
What Does the Crypto Fear & Greed Index Show, and Why Isn't It a Trading Signal?
On September 25 the Fear & Greed Index reads 71, “Greed”; on August 17 it was 31, “Fear”. We explain what goes into the index, why different sites show different values, and why it describes past market mood rather than future price.
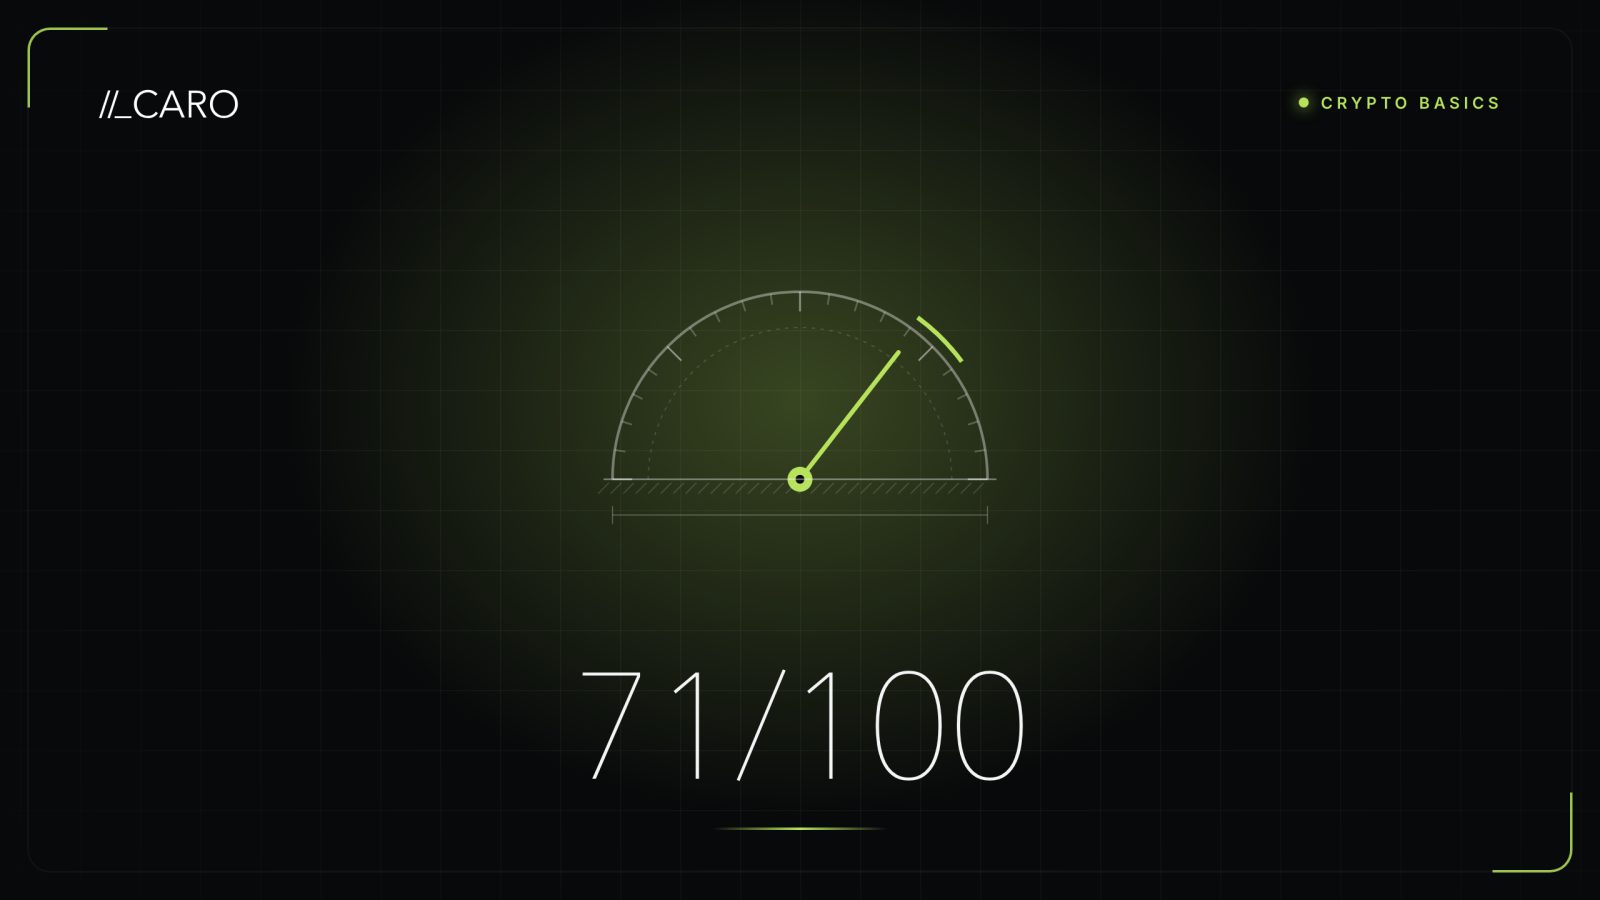
The Fear & Greed Index is a number from 0 to 100 that combines several market measurements into one score: volatility, price and volume momentum, social media activity and search interest. Low values are labelled “fear”, high values “greed”. The index describes sentiment that is already reflected in prices, so it does not say where the market goes next and is not a buy or sell signal.
What does the index show right now?
According to Alternative.me, on September 25, 2026 the index stands at 71, “Greed”. On September 22 it reached 78, “Extreme Greed”; on September 17 it was 50, “Neutral”; and on August 17 it was 31, “Fear”. Bitcoin rose over that month: per Yahoo Finance, on September 24 it was 8.5% higher than a month earlier. The index followed the price rather than leading it.
What goes into the index?
The best-known version, Alternative.me, has six components:
| Component | Weight | What it measures |
|---|---|---|
| Volatility | 25% | Current Bitcoin volatility and drawdowns vs. 30- and 90-day averages |
| Momentum and volume | 25% | Current volume and momentum vs. averages |
| Social media | 15% | Posts and interactions using crypto hashtags |
| Surveys | 15% | Weekly polls, currently paused |
| Dominance | 10% | Bitcoin's share of total market cap |
| Trends | 10% | Google Trends search volume |
The logic is simple: spikes in volatility and in Bitcoin's share read as fear; heavy volume in a rising market and a burst of interest read as greed.
Why do different sites show different values?
There is no standard methodology. CoinMarketCap builds its index from different parts: price momentum of the top ten coins, implied volatility from Volmex indices, the put/call ratio in options, the stablecoin supply ratio and its own search and user-engagement data. On September 25 it read 72 — close to Alternative.me's 71, but on other days the gap can be wider. Comparing different indices with each other is pointless; compare one index with its own history.
Why doesn't the index predict price?
Almost every component looks backward: yesterday's volatility, a rally that already happened, a search spike that already occurred. When price rises, the index follows; when price falls, so does the index. “Greed” can last for weeks while the market keeps rising, and “fear” while it keeps falling. “Buy fear, sell greed” sounds sensible, but the index does not tell you when fear will end or how much further price will drop first. We covered handling emotions around headlines and numbers in “How can beginners read crypto news without FOMO?”.
How can a beginner use the index sensibly?
- As a thermometer: it quickly shows how “heated” the market is compared with recent weeks.
- As a self-check: if you feel the urge to buy at “extreme greed” or sell at “extreme fear”, ask whether the crowd is making the decision for you.
- Alongside other data — price, volume, rate news and liquidity — not instead of them.
What are the limitations?
The index is built mostly on Bitcoin data and says little about individual altcoins. The weights are chosen by its authors and have not been validated as a forecasting model. Some inputs, such as social media, are easily distorted by bots. One of Alternative.me's components — surveys — is paused, so the actual contribution of the other parts differs from the stated weights. Above all, the index knows nothing about your goals, time horizon or risk tolerance — the decision is always yours.
Sources
- Alternative.me — Crypto Fear & Greed Index — https://alternative.me/crypto/fear-and-greed-index/
- Alternative.me — Fear & Greed Index API (historical values) — https://api.alternative.me/fng/?limit=40
- CoinMarketCap — Crypto Fear and Greed Index — https://coinmarketcap.com/charts/fear-and-greed-index/
- Yahoo Finance — Bitcoin and ethereum prices today, September 24, 2026 — https://finance.yahoo.com/personal-finance/investing/article/bitcoin-and-ethereum-prices-today-thursday-september-24-2026-crypto-prices-lose-ground-as-rate-hike-expectations-grow-114459916.html
This article is for information only and is not individual investment advice. Trading crypto carries the risk of losing your funds; results on historical data do not guarantee future results.
Check the strategy against your own data
ACARO is a terminal that executes a strategy on your own exchange account. Parameter search and backtesting on history are part of the subscription.
See pricing